ParSeq
Package ParSeq is a python software library for Parallel execution of Sequential data analysis. It implements a general analysis framework that consists of transformation nodes – intermediate stops along the data pipeline to visualize data, display status and provide user input – and transformations that connect the nodes. It provides an adjustable data model (supports grouping, renaming, moving and drag-and-drop), tunable data format definitions, plotters for 1D, 2D and 3D data, cross-data analysis routines and flexible widget work space suitable for single- and multi-screen computers. It also defines a structure to implement particular analysis pipelines as relatively lightweight Python packages.
ParSeq is intended for synchrotron based techniques, first of all spectroscopy.
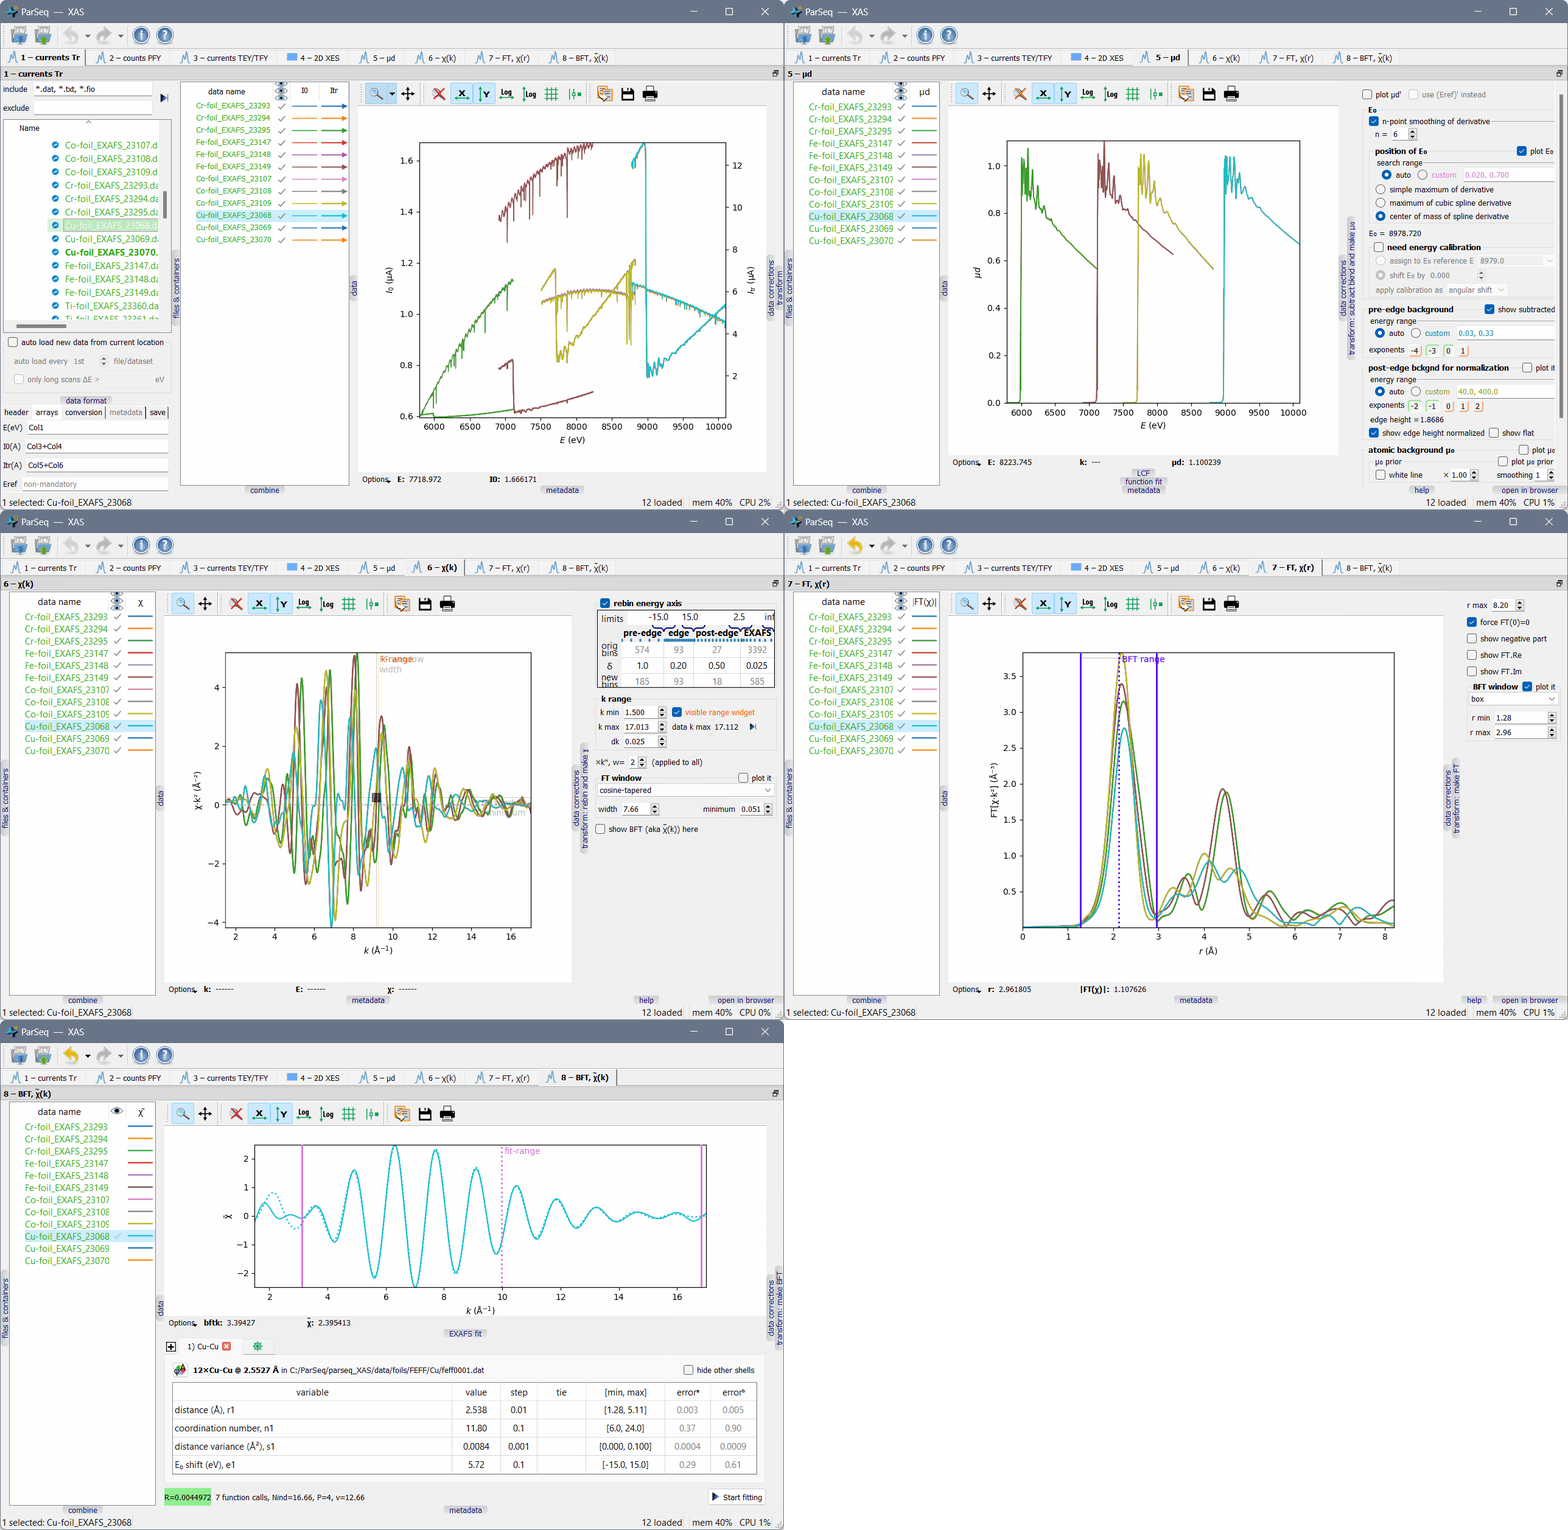
A screenshot of ParSeq-XAS (an EXAFS analysis pipeline) as an application example:

Main features
ParSeq allows creating analysis pipelines as lightweight modules.
Flexible use of screen area by detachable/dockable transformation nodes (parts of analysis pipeline).
Two ways of acting from GUI onto multiple data: (a) simultaneous work with multiply selected data and (b) copying a specific parameter or a group of parameters from active data items to later selected data items.
Undo and redo for most of treatment steps.
Entering into the analysis pipeline at any node, not only at the head of the pipeline.
Creation of cross-data combinations (e.g. averaging, RMS or PCA) and their propagation downstream the pipeline together with the parental data. The possibility of termination of the parental data at any selected downstream node.
Parallel execution of data transformations with multiprocessing or multithreading (can be opted by the pipeline application).
Optional curve fitting solvers, also executed in parallel for multiple data items.
Informative error handling that provides alerts and stack traceback – the type and location of the occurred error.
Export of the workflow into a project file. Export of data into various data formats with accompanied Python scripts that visualize the exported data for the user to tune their publication plots.
ParSeq understands container files (presently only hdf5) and adds them to the system file tree as subfolders. The file tree, including hdf5 containers, is lazy loaded thus enabling big data collections.
A web viewer widget near each analysis widget displays help pages generated from the analysis widget doc strings. The help pages are built by Sphinx at the startup time.
The pipeline can be operated via scripts or GUI.
Optional automatic loading of new data during a measurement time.
The mechanisms for creating nodes, transformations and curve fitting solvers, connecting them together and creating Qt widgets for the transformations and and curve fits are exemplified by separately installed analysis packages:
Dependencies
Launch an example
Either install ParSeq and a ParSeq pipeline application by their installers to
the standard location or put them to any folder in their respective folders
(parseq and e.g. parseq_XES_scan) and run the *_start.py module of
the pipeline. You can try it with --help to explore the available options.
An assumed usage pattern is to load a project .pspj file from GUI or from
the starting command line.
Hosting and contact
The ParSeq project is hosted on GitHub. Please use the project’s Issues tab to get help or report an issue.


